How to interpret IR spectra with the whole bunch of peaks that jump out at you right away?
Well, that is the purpose of this post: how to interpret and solve IR spectroscopy problems, keeping things simple.
In a typical exam question, you will be given an IR spectrum and asked to identify the correct molecule, so let’s put together a clear guide on solving these types of problems.
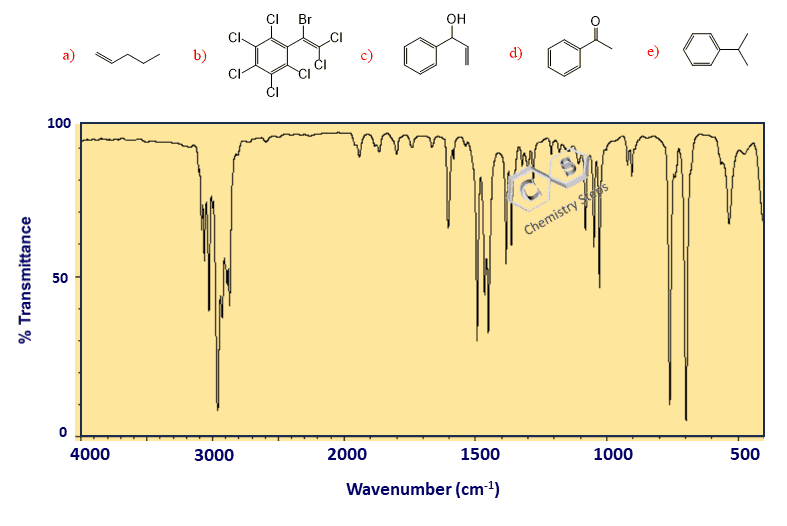
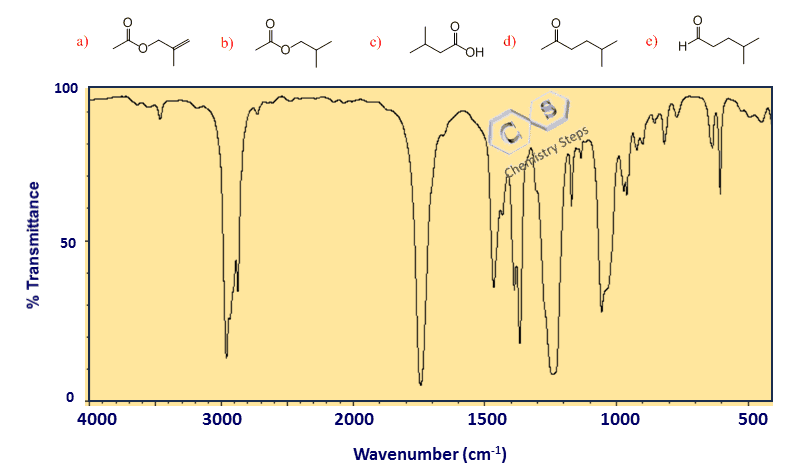
For example, identify the correct compound based on the following IR spectrum:

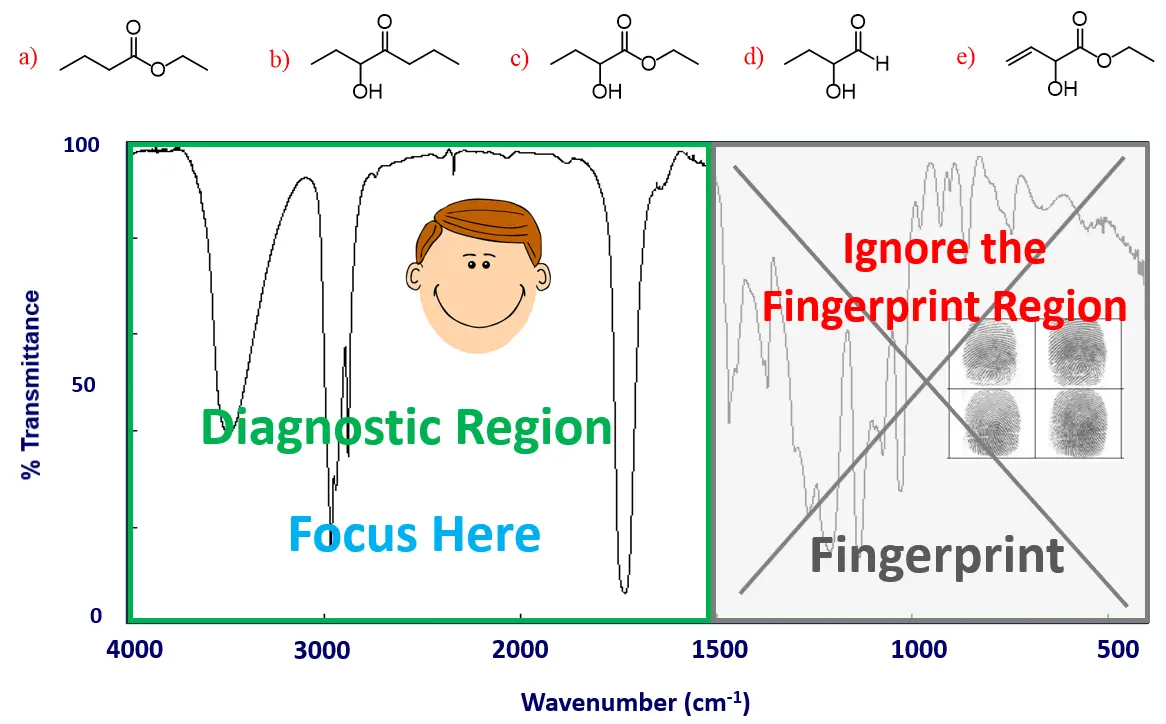
The first thing you need to know is that we have two regions in an IR spectrum: the diagnostic and the fingerprint regions.

Identifying a compound from an IR spectrum is like identifying a suspect with photos and fingerprints. The diagnostic region (functional group signals) is like the photos – clear and easy to recognize. The fingerprint region is, well, the fingerprints – unique but often unnecessary if the photos already make the suspect obvious.
So, speaking of interpreting IR spectra, the good news is that you can simply cross out or ignore the fingerprint region of up to ~1500 cm-1 – at least when starting the analysis:
From here, we work on identifying the functional groups responsible for the signal in the diagnostic region. We are going to follow a three-step strategy that will help you solve 80% of IR spectroscopy questions on your test.
Step 1: Draw a Line at Exactly 3000 cm-1
This region shows the vibrational frequencies of carbon-hydrogen bonds, and the line at exactly 3000 cm-1 tells us the hybridization of the carbon(s) connected to hydrogen(s):
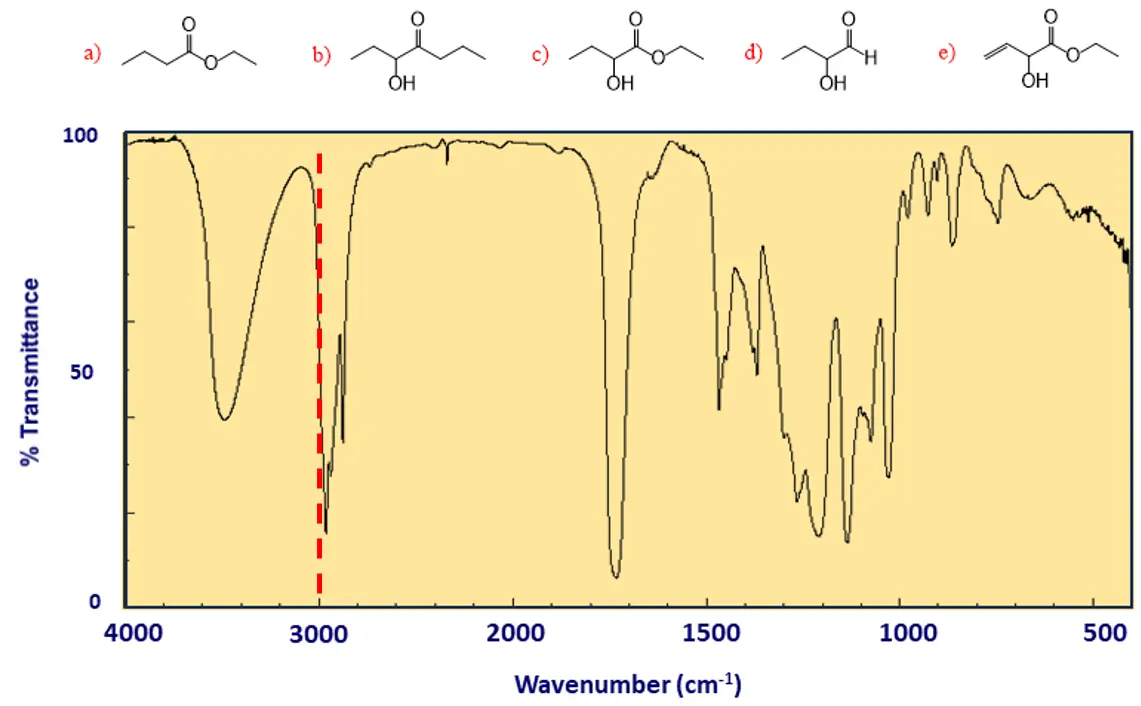
- If the absorption peaks are below 3000 cm-1, then the molecule contains SP3 C-H bond(s) only.
- If the peaks are slightly above 3000 cm-1, the molecule contains SP2 C-H bond(s).
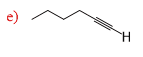
- If there is a distinct peak at 3300 cm-1, the molecule contains SP C-H bond(s).

In our example, there is no signal beyond the 3000 cm-1 line; therefore, there are no sp2 C-H bonds in the molecule. We only have SP3 C-H bonds since the peaks are below 3000 cm-1. This means we can exclude molecule (e) from the candidates list:

Step 2. A broad peak at ~3200-3600 cm-1
Once we know what types of hybridizations the carbon connected to hydrogens have, we check whether there is an OH and NH peak in the molecule. These bonds are characterized by a broad absorption peak at ~3200-3600 cm-1 due to hydrogen bonding.

Notice that the OH peak can imply an alcohol or a carboxylic acid. Alcohols and phenols typically show a strong, broad peak due to hydrogen bonding of the O–H group, while carboxylic acids give an even broader signal that often overlaps into the 2500–3000 cm⁻¹ range.
Amines and amides have distinguishable patterns: a primary amine (–NH₂) shows two small spikes, a secondary amine (–NH) shows one spike, and a tertiary amine gives no peak at all because it lacks an N–H bond. Amides produce N–H stretching absorptions as well, often appearing slightly sharper than those of alcohols.
So, now, take a moment and see if this helps you identify or exclude any candidate molecules from the list.
There is a broad peak in the spectrum, indicating either an OH or an NH group; however, there is no NH in any of the candidate molecules, and the only one lacking an OH is molecule a:

Step 3: Check for a Carbonyl Peak at 1700 cm-1
In the third step, we are going to check if the molecule contains a carbonyl (C=O) functional group. Remember, there are a number of functional groups, such as acids, esters, acid chlorides, aldehydes, and ketones that contain a carbonyl. This is an important and signature IR peak at about 1700 cm⁻¹, as it is clearly distinguishable from other peaks in the region and is usually of strong intensity.
Going back for a moment to the OH and NH peak, we said that it can indicate an alcohol, an acid, an amine, and an amide. Now that we know about the carbonyl peak in the 1700 cm-1 region, we can say that:
- If the molecule is an acid, it will have OH and C=O bands, while an alcohol would only have OH.
- If an amide, it will have an N-H and C=O, while the amine would only have N-H. *Notice also that the carbonyl peak of primary amides is split into two.
In our example, we do have a carbonyl peak; however, I have chosen three such candidate molecules to continue our analysis by addressing a few additional details when interpreting IR spectra.

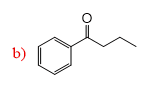
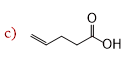
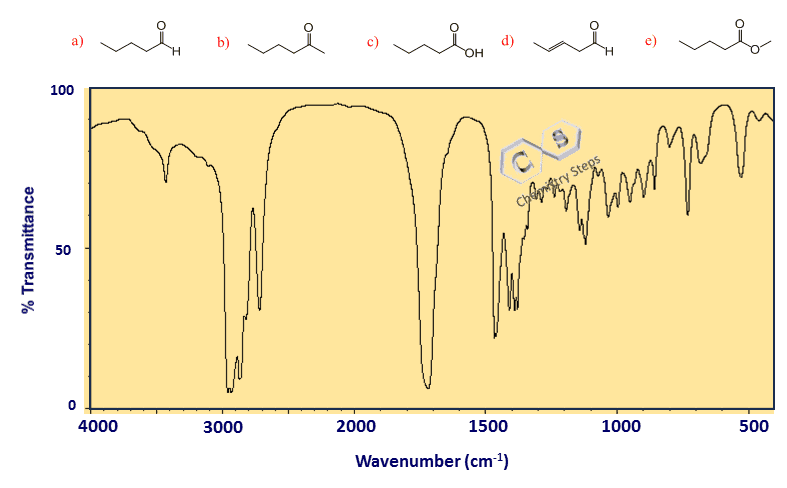
The three candidate molecules are a ketone (b), an ester (c), and an aldehyde (d). So, how do we distinguish these functional groups?
Here are characteristic peaks for esters and aldehydes:
- If an ester – strong bands of C-O at ~1100-1200 cm-1
- If an aldehyde – a distinct peak at ~2750 cm-1
We do not have a peak at 2750 cm-1, but we do have some strong signals at 1100-1200 cm-1, which means the correct answer is c.

The Most Common IR Absorption Peaks
At this point, let’s also summarize the most common IR absorption peaks for functional groups in a clear table.

Summary of Interpreting IR Spectra
Interpreting IR spectra doesn’t have to feel overwhelming, even when a whole bunch of peaks jump out at you at once. Following a simple three-step strategy should allow you to solve most exam questions.
-
Draw a Line at 3000 cm⁻¹ – This helps you quickly identify the hybridization of the carbons connected to hydrogens. Peaks below 3000 cm⁻¹ indicate sp³ C-H bonds, slightly above 3000 cm⁻¹ show sp², and a sharp signal around 3300 cm⁻¹ points to sp C-H bonds.
-
Look for a Broad Peak at 3200–3600 cm⁻¹ – This region signals O-H or N-H bonds. Alcohols, phenols, and acids show broad O-H peaks, while amines and amides show N-H peaks (primary amines with two spikes, secondary with one, tertiary with none).
-
Check for a Carbonyl Peak Around 1700 cm⁻¹ – A strong, distinct C=O stretch indicates carbonyl-containing groups such as acids, esters, aldehydes, ketones, or amides. Combining this information with the O-H/N-H peaks allows you to distinguish, for example, between an alcohol vs. an acid or an amine vs. an amide.
Using these three steps together – C-H hybridization, broad O-H/N-H peaks, and carbonyl identification, you can identify the correct answer or at least exclude the others. If not solved, look for distinguishing peaks such as the C-O for esters (1100-1200 cm-1) or the aldehyde C-H at ~2750 cm⁻¹, to finalize your answer.