So, you talked about IR spectroscopy in class, and now it’s time to summarize what you’ve learned and start solving some practical problems. The first step in doing that is to know the key absorption signals in IR spectroscopy.
This IR absorption table lists the most important signals you need to recognize when interpreting IR spectra. All these key absorptions fall within the diagnostic region of the IR spectrum, which starts around 1500 cm⁻¹ and stretches up to about 3600 cm⁻¹.
This region is where we focus because it contains the characteristic absorption bands of functional groups such as the C=O carbonyl peak, different types of C-H signals, O–H, N–H, and more.
| Table of IR Absorptions |
|||
|---|---|---|---|
| Functional Group / Bond | Wavenumber (cm⁻¹) | Intensity / Shape | Notes |
| O–H (alcohols, acids) | 3200–3600 | Strong, broad | Hydrogen bonding causes broadening |
| N–H (amines, amides) | 3300–3500 | Medium, sharp | 1° amine: two peaks; 2° amine: one peak |
| C–H (alkanes) | 2850–2960 | Strong, sharp | sp³ C–H stretches |
| =C–H (alkenes) | ~3020 | Medium | sp² C–H stretch |
| ≡C–H (alkynes) | ~3300 | Strong, sharp | sp C–H – Sharp peak |
| C=O (carbonyls) | 1650–1750 | Strong, sharp | Very diagnostic; position varies by type |
| C=C (alkenes) | 1600–1680 | Medium | Weaker than C=O |
| C≡C (alkynes) | 2100–2260 | Variable | Weak if internal, stronger if terminal |
| C≡N (nitrile) | 2210–2260 | Medium, sharp | Characteristic nitrile peak |
| C–O (alcohols, ethers, esters, acids) | 1000–1300 | Strong | Often multiple peaks |
| ⌬ Aromatic C=C | 1450–1600 | Medium | Distinctive “fingerprint” pattern |
| ⌬ Overtones | 1660–2000 | Weak | A series of small peaks |
The Use of the IR Table in Solving Practice Problems
We can’t have a single strategy that works for every IR spectrum, but there are three key signals you should focus on to cover the majority of typical IR questions:
-
The –OH or –NH peak – broad signals that indicate alcohols, amines, or amides.
-
The types of C–H bonds present – peaks around 3000 cm⁻¹ that tell you whether the carbon is sp³, sp², or sp hybridized.
-
The carbonyl (C=O) peak – a strong, distinct signal around 1700 cm⁻¹ that points to aldehydes, ketones, esters, acids, or related groups.
Focusing on these three regions will help you quickly identify the core functional groups in most molecules you encounter in exams.
If the molecule contains –OH or –NH/–NH₂ groups, the signal is going to appear on the left side of the spectrum, and you can easily recognize it because these peaks are much broader than most other signals.

Next to this, at about 3000 cm⁻¹, you are going to see the C–H stretching signals. Depending on the hybridization of the carbon, these peaks can appear in slightly different regions:
-
sp³ C–H bonds (alkanes) typically show stretches just below 3000 cm⁻¹.
-
sp² C–H bonds (alkenes and aromatics) appear just above 3000 cm⁻¹.
-
sp C–H bonds (alkynes) absorb even higher, around 3300 cm⁻¹, often as sharp peaks.
Recognizing these subtle differences is crucial for identifying the type of carbon framework in your molecule and distinguishing between alkanes, alkenes, alkynes, and aromatic compounds.

The next important signal to watch for is the C=O absorption around 1700 cm⁻¹. This is the infamous carbonyl signal, and it’s usually very distinct and strong, making it one of the easiest peaks to spot in an IR spectrum. The presence of this peak indicates that the molecule contains a carbonyl group, which could be part of an aldehyde, ketone, ester, carboxylic acid, or other carbonyl-containing functional groups.
Because the carbonyl stretch is so characteristic, it serves as a reliable marker when identifying functional groups and confirming molecular structures. Subtle shifts in the exact position of this peak can even give clues about the specific type of carbonyl, for example, aldehydes often appear slightly lower than ketones, and esters slightly higher.
For example, this molecule contains a carbonyl peak, and in compounds like menthone, it is stronger than the rest of the peaks. Can you identify the correct structure?

To summarize the most important signals and their regions on an IR spectrum, let’s also include this visual table for easy reference:

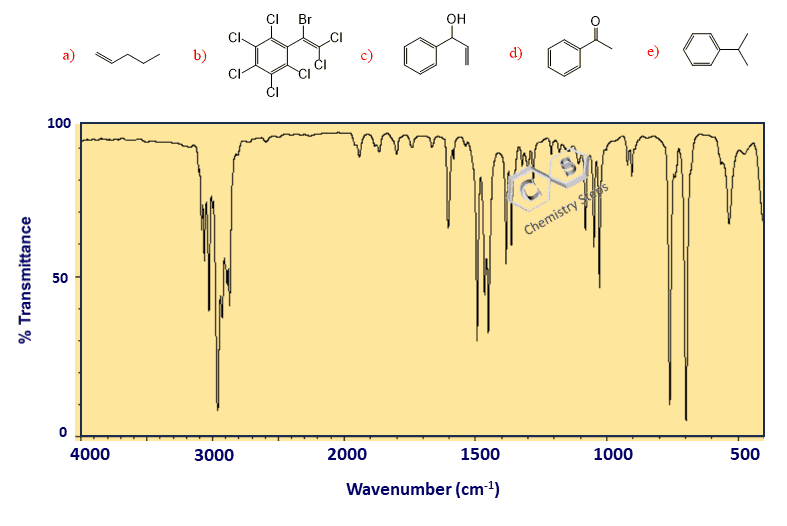
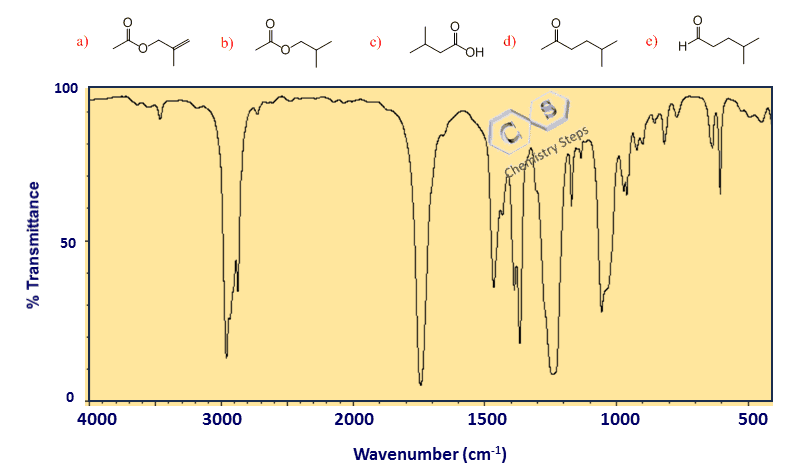
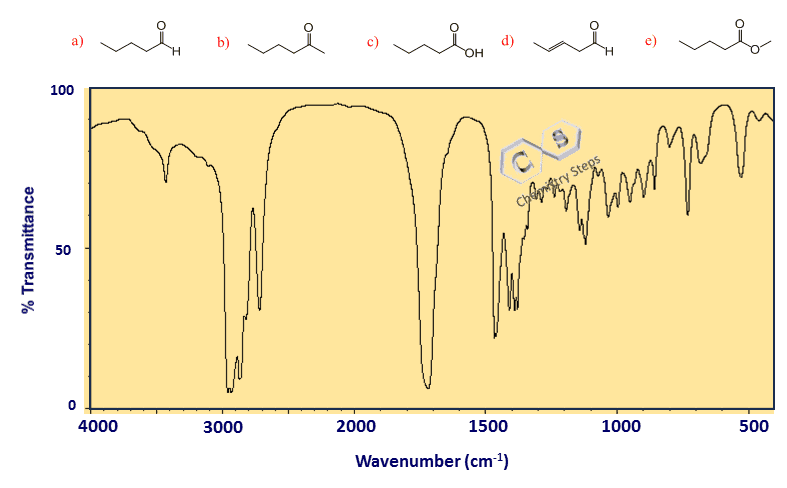
Below are some practice problems on identifying the correct molecule based on IR spectra. Refer to this strategy for solving them, as these are the types of questions you’ll most often encounter on exams.
-
Draw a Line at 3000 cm⁻¹ – This helps you quickly identify the hybridization of the carbons connected to hydrogens. Peaks below 3000 cm⁻¹ indicate sp³ C-H bonds, slightly above 3000 cm⁻¹ show sp², and a sharp signal around 3300 cm⁻¹ points to sp C-H bonds.
-
Look for a Broad Peak at 3200–3600 cm⁻¹ – This region signals O-H or N-H bonds. Alcohols, phenols, and acids show broad O-H peaks, while amines and amides show N-H peaks (primary amines with two spikes, secondary with one, tertiary with none).
-
Check for a Carbonyl Peak Around 1700 cm⁻¹ – A strong, distinct C=O stretch indicates carbonyl-containing groups such as acids, esters, aldehydes, ketones, or amides. Combining this information with the O-H/N-H peaks allows you to distinguish, for example, between an alcohol vs. an acid or an amine vs. an amide.
Using these three steps together – C-H hybridization, broad O-H/N-H peaks, and carbonyl identification, you can identify the correct answer or at least exclude the others. If not solved, look for distinguishing peaks such as the C-O for esters (1100-1200 cm-1) or the aldehyde C-H at ~2750 cm⁻¹, to finalize your answer.