Let’s discuss today how we identify an unknown compound from the combined data of IR, NMR, and Mass Spectrometry.
A typical question you will see would be formulated as:
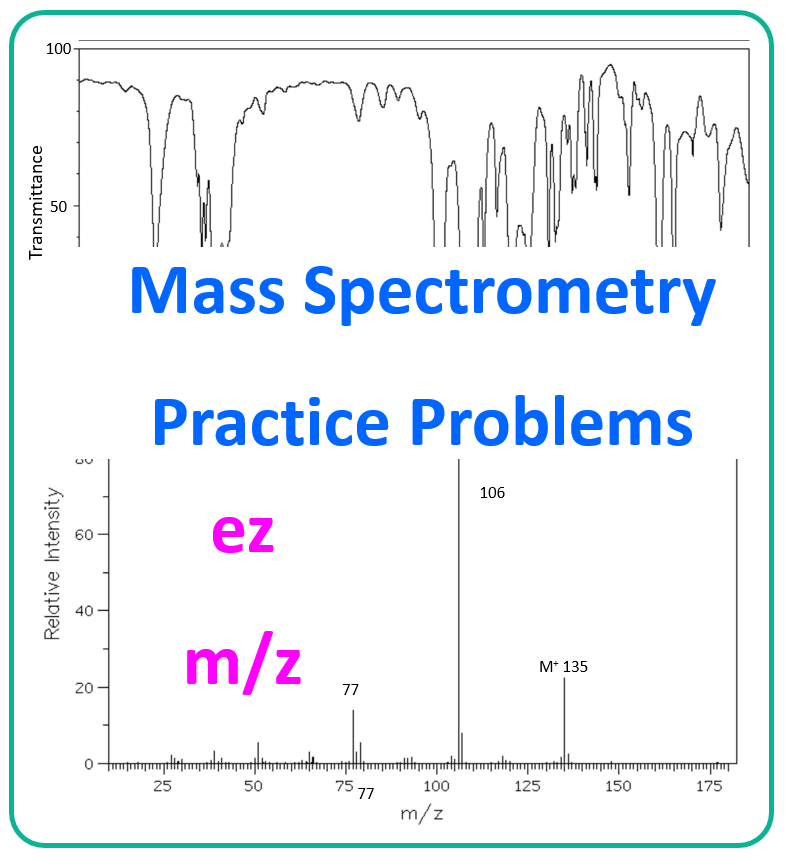
Identify the molecule that gives the following IR and Mass spectra data. Let’s leave the NMR aside for the moment:

Molecular Ion Peak
The first thing you should do is look for the molecular ion peak on the right side of the mass spectrum. Here, we have a peak at m/z 100, so let’s assume it is the molecular ion peak; therefore, the molar mass of the unknown.
Analyze the IR Data
Do not aim for figuring out the full structure from the IR spectra – focus on the main parts:
- the C–H region around 3000 cm⁻¹
- the O–H / N–H broad peak region at ~3500 cm⁻¹
- the carbonyl peak at ~1700 cm⁻¹
In this case, we can see that there is a carbonyl peak, and no other unsaturation as there are no C–H signals beyond 3000 cm⁻¹, and no C=C or triple bond signals. Check the post Interpreting IR Spectra to refresh these patterns.
The Rule of 13
Next, we can use the rule of 13 to determine the molecular formula. It is a shortcut in mass spectrometry for proposing possible molecular formulas from the molecular ion peak. The idea is to divide the molecular mass by 13, which is the mass of the average –CH fragment (12 from C + 1 from H), to get an estimate of how many carbon atoms are in the molecule.
The molecular mass is 100, and from the IR data, we know that there is at least one oxygen in the molecule. This means we need to adjust the molar mass by subtracting 16 from 100 before dividing by 13.
So, we have 84 ÷ 13 = 6, which implies C₆H₆. Add the oxygen to get all the atoms in: C₆H₆O. The molar mass of C₆H₆O is 94, which gives a remainder of 100 – 94 = 6. Lastly, we add 6 hydrogens to the molecular formula, which gives us C₆H₁₂O.
Combine the IR and MS Data
The presence of the carbonyl peak and lack of an O–H suggest that we have either an aldehyde or a ketone. However, remember that aldehydes have a signal at ~2800 cm⁻¹, which is not present in the spectrum. Therefore, the compound is a ketone.
Analyze the Fragments in the Mass Spectrum
We know that the two main fragmentation paths of ketones are alpha cleavage and McLafferty rearrangement. Remember that not all ketones and carbonyl-containing compounds undergo McLafferty rearrangement, as it requires the alkyl chain to be long enough to supply a γ-hydrogen. A ketone with six carbons can have such a structure, but we do not know this for sure yet. So, let’s first examine any common alpha cleavage fragments. The first one to notice is the peak at m/z 43. This is a good indicator of a methyl ketone since it produces the CH₃CO⁺ acylium ion.
However, the m/z 43 peak is also very common in many compounds with a propyl group, and especially with an isopropyl group, so we cannot conclude that it definitely indicates a methyl ketone. Assuming it does, though, the question becomes how the carbons are connected on the other side of the carbonyl. The only option here is hexan-2-one, since that is the only way to have a γ-carbon available.
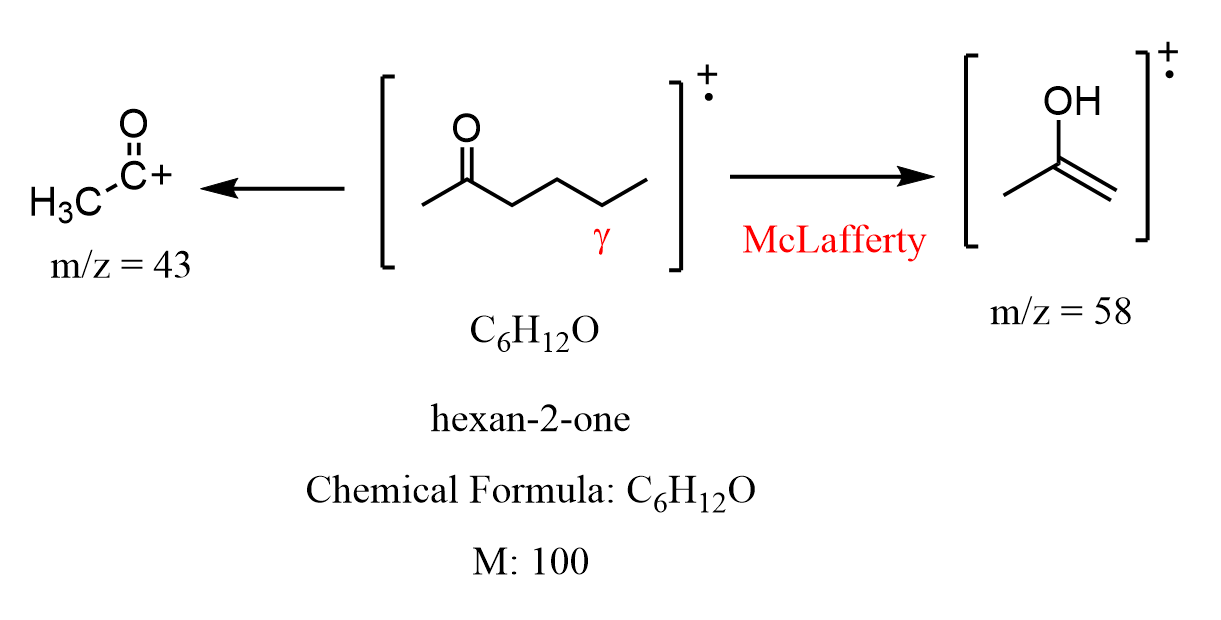
The McLafferty fragment peak of the presumed ketone is at m/z 58. The spectrum, however, does not show a peak at m/z 58, so most likely, none of the chains of the ketone is long enough to have a gamma hydrogen.
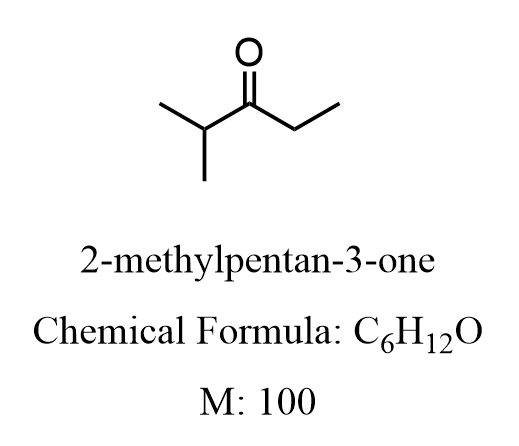
So, what are the possible structures of the ketone? If we restrict the length of both alkyl chains, then the only option is 2-methylpentan-3-one. The alpha cleavage on both sides confirms the observed acylium ion peaks at m/z 72 and 57. This means the peak at 43 is most likely from the isopropyl fragment.
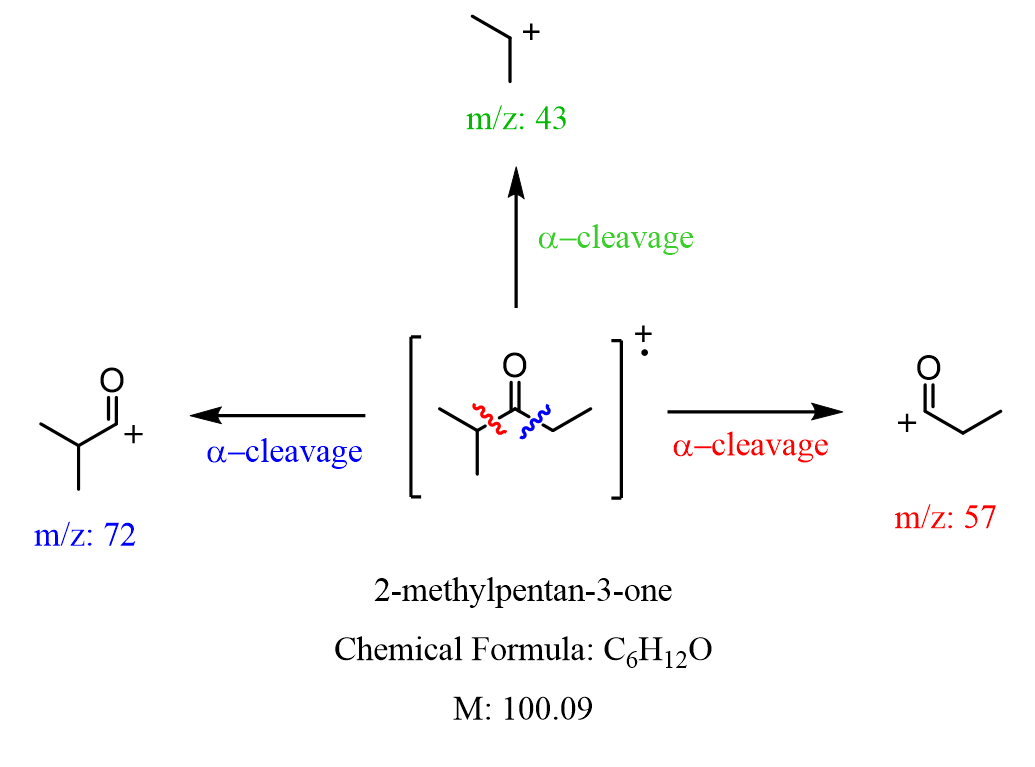
All the peaks match with what we see on the mass spectrum, and this is very much all we can squeeze out of the MS and IR data.
Analyze NMR Data
We’ve actually determined the structure of the unknown, and wouldn’t even need to go this far if the NMR were given, but I wanted to show the thought process in analyzing the MS and IR data, especially given that, in real life, we do not rely on mass spectra alone to confirm the formation of a product. There are several reasons for this, but the main one is that a mass spectrum only shows what was detected, which does not necessarily mean there aren’t other components present. It is also difficult to tell which components are detected more easily than others.
In any case, let’s also look at the NMR spectrum.
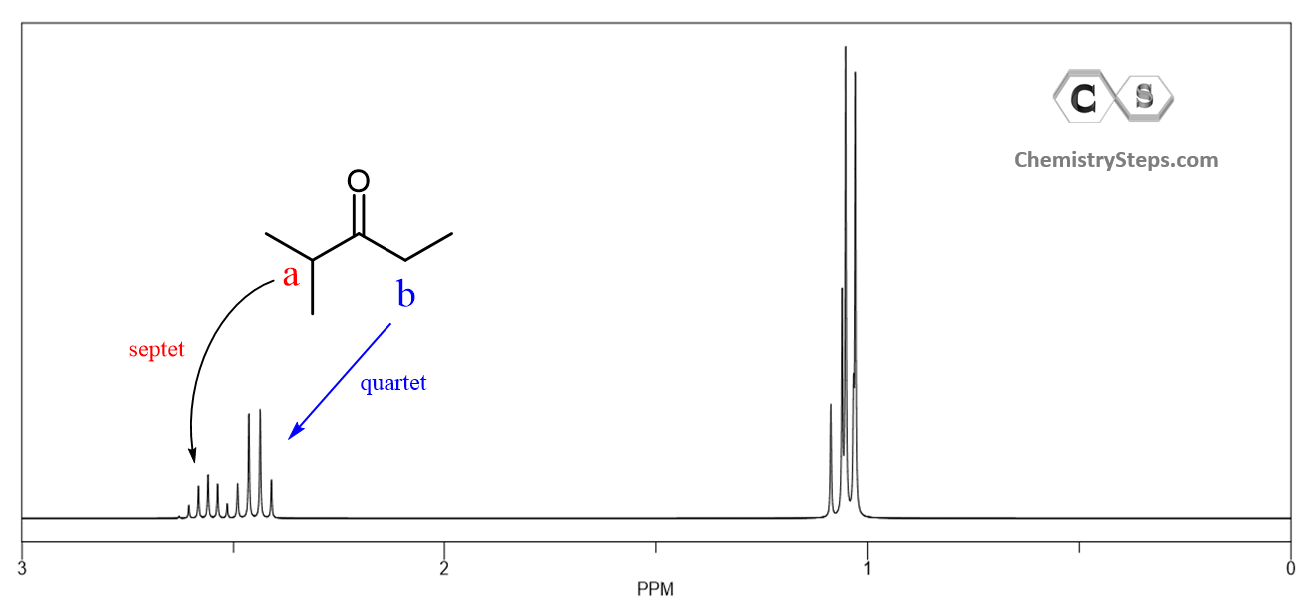
The most downfield peak (to the left) at about 2.6 ppm is a septet (proton a), and the one next to it is a quartet (protons b). A septet is a classic indicator of an isopropyl group – a proton neighboring six equivalent protons from two methyl groups (CH₃–CH–CH₃). The quartet is likely a CH₂ connected to a CH₃, which means we also have an ethyl group.
On the right side, we see the signals of the methyl groups overlapping, so it is not easy to analyze the splitting. The integration data would have confirmed the number of protons.
So, the final answer is that the unknown compound is 2-methylpentan-3-one.
Do you need more practice problems like this? Check out our comprehensive guide and the full set of mass spectrometry problems, including those with combined data from MS, IR, and NMR spectroscopy.
- Solving Mass Spectrometry Practice Problems
- Mass Spectrometry Practice Problems
- IR Spectroscopy Practice Problems
- NMR Spectroscopy Practice Problems